Creating a Premier global
gold company

Our
Story

It’s all in the name… we’ve evolved from a small company into a globally relevant gold mining business with a reputation of delivering value for all stakeholders. Underpinning it all, is our Australian story and spirit. We dare our people to think differently, we act like owners and we live our values of safety, accountability, excellence and respect.
Our
Operations

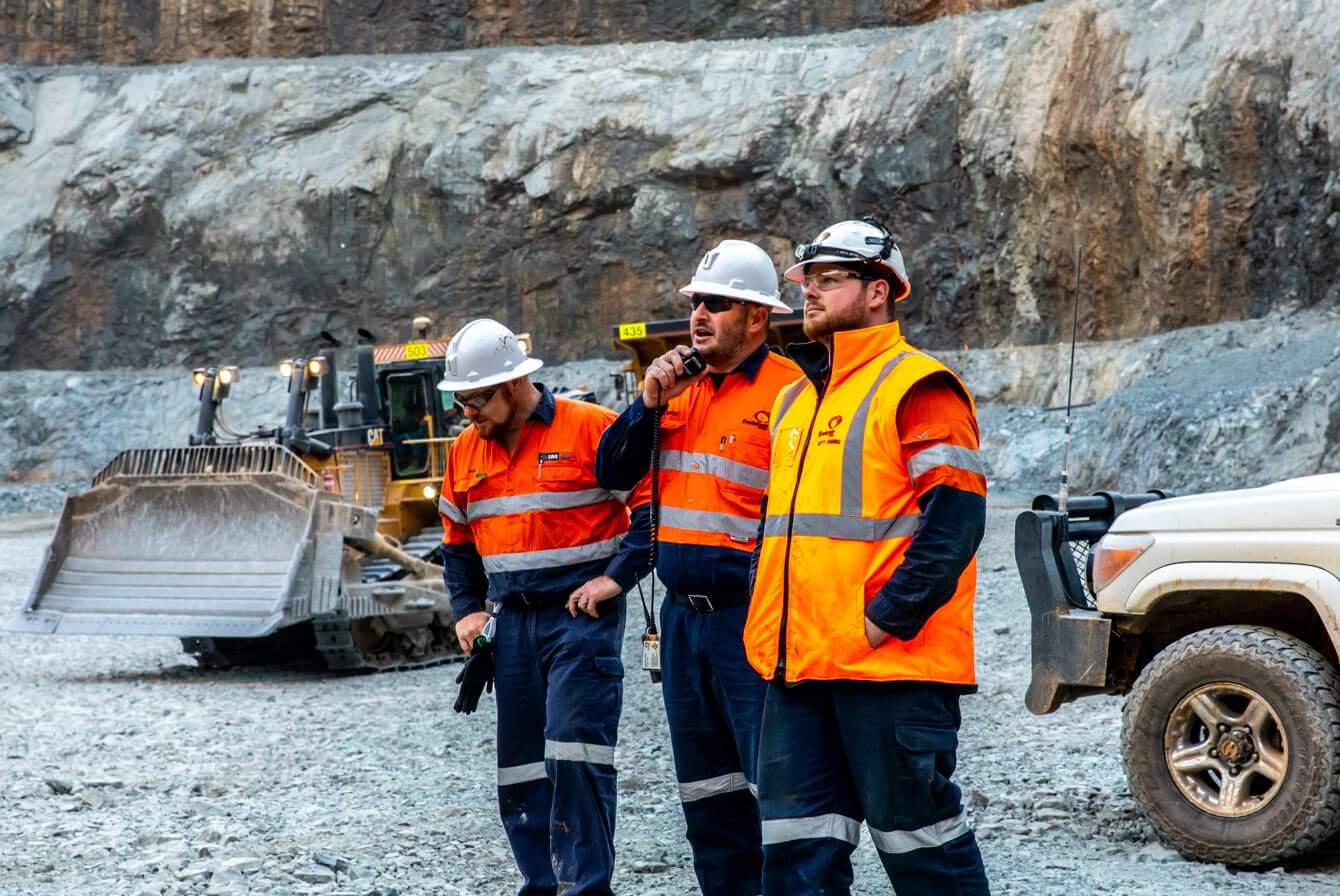
Evolution Mining is a leading, globally relevant gold miner. Evolution currently operates six mines, being five wholly-owned mines – Cowal in New South Wales, Ernest Henry and Mt Rawdon in Queensland, Mungari in Western Australia, and Red Lake in Ontario, Canada, and an 80% share of Northparkes in New South Wales.

The focus of Evolution Mining is on operating its projects safely and efficiently and developing them to their full potential.

FY25 Highlights

In FY25 we produced 750,512 ounces of gold at an All-in sustaining cost (AISC) of $1,572 per ounce, and 76,261 tonnes of copper.

751

KOZ

Gold Produced

76

kt

copper production

$

2.3

B

Operating Mine Cash Flow

$

787

M

Group cash flow

$

1,572

/OZ

All-in sustaining cost

$

958

M

underlying profit after tax

$

2,161

M

EBIDTA

13

CPS

record final fully franked dividend – 25th consecutive dividend

30

MOZ

Minerals Resources – contained gold

4.4

MT

Mineral Resources – contained copper

35

%

improvement in TRIF during the year to 4.98(1)

11

MOZ

Ore Reserves – contained gold

1.4

MT

Ore Reserves – contained copper

1 TRIF: the frequency of total recordable injuries per million hours worked. Results are based on 12-month moving average (12mma).

FY24 Highlights

In FY24 we produced 716,700 ounces of gold at an AISC of A$1,477 per ounce – among the lowest cost gold producers in the world. 

717koz

Gold Production

68kt

Copper Production

$1,541M

Operating Mine Cash Flow

$1,477oz

All-in Sustaining Cost

$422M

Statutory net profit after tax

$139M

dividends declared

32.7Moz

Mineral Resources – Contained gold

4.1Mt contained copper
~13%
Improvement in TRIF during the year to 7.72

11.4Moz

Ore Reserves –
contained gold

1.3Mt contained copper

$2.7B

Contribution to the
Australian and Canadian economies1

  1. Economic contributions include supplier payments, wages, dividend payments, interest, taxes, royalties, community investment, payments to providers of capital and payments to financial institutions (interest). Local and regional organisations are defined by postcode in relation to geographical proximity to Evolution mine sites.

  2. TRIF: the frequency of total recordable injuries per million hours worked. Results are based on 12-month moving average (12mma). The reduction is against the FY23 adjusted baseline including Northparkes.

Sustainability

Our sustainability vision is to deliver long-term stakeholder value through safe, low cost gold production in an environmentally and socially responsible way.
~12%

Reduction in emissions against adjusted FY20 baseline1, progressing our commitment to Net Zero by 2050 and on track to meet 30% reduction by 2030.

13%

Improvement in TRIF during the year to 7.72.

2.7B

Contributed to the Australian and Canadian economies3 and $419 million to local and regional businesses4 and organisations.

87%

of employees choosing to stay at evolution in a tight competitive market.

‘AA’ MSCI ESG rating’

the highest rating among global gold mining peers.

High Approval

Social Licence to Operate score recorded in our biennial Stakeholder Perception Survey.

45%

Improvement in FY24 freshwater usage intensity compared to adjusted FY20 baseline, exceeding target.

19%

Female workforce representation. Gender diversity has improved marginally year-on-year as we work toward our FY25 target of 22% female participation.

  1. Net Zero commitment of 30% emissions reduction by 2030 and Net Zero emissions by 2050, compared to FY20 baseline. Emissions targets are related to Scope 1 and Scope 2 only. Assessed using market-based method. Update from preliminary value of ~14% reduction reported in FY24 Directors’ Report following inclusion of Corporate and Exploration data and completion of external verification process.
  2. TRIF: the frequency of total recordable injuries per million hours worked. Results are based on 12-month moving average (12mma). The reduction is against the FY23 adjusted baseline including Northparkes.
  3. Economic contributions include supplier payments, wages, dividend payments, interest, taxes, royalties, community investment, payments to providers of capital and payments to financial institutions (interest).
  4. Local and regional organisations are defined by postcode in relation to geographical proximity to Evolution mine sites. 
Evolution has a strong platform of high-quality assets with an average reserve life of more than 14 years. All assets are located in the safe jurisdictions of Australia and Canada with a highly skilled workforce, and in an attractive operating environment. Our balance sheet is strong, our assets are generating substantial cash flow and our business is now well positioned to prosper through the cycle.
Jake Klein - Chair

Key News

Upcoming Events

  • 15 October 2025

    September 2025 Quarter Results

  • 20 November 2025

    Annual General Meeting

  • 21 January 2026

    December 2025 quarter results

  • 11 February 2026

    FY26 half year results

  • 15 April 2026

    March 2026 quarter results

  • 15 July 2026

    June 2026 quarter results

  • 12 August 2026

    FY26 full year results

  • 14 October 2026

    September 2026 quarter results

2024 Annual Report
Job opportunities
Scroll to Top

LATEST NEWS

UPCOMING EVENTS

Disclaimer

Please note that you are now entering a website directly or indirectly maintained by a third party (the “External Site”) and that you do so at your own risk.

Evolution Mining LTD., (“EVN”) has no control over the External Site, any data or other content contained therein or any additional linked websites. The link to the External Site is provided for convenience purposes only.

By clicking “Accept” you acknowledge and agree that neither EVN nor third party provider Virtua Research, Inc. (“Virtua) is responsible, or accepts or assumes any responsibility or liability whatsoever for, the content, the data or the technical operation of the Linked Site. Further, by entering the External Site, you also acknowledge and agree that you completely and irrevocably waive any and all rights and claims against EVN and Virtua and further acknowledge and agree that in no event shall EVN or Virtua, its officers, employees, directors and agents be liable for any (i) indirect, consequential, incidental, special, compensatory or punitive damages, (ii) damages for loss of income, loss of business profits, business interruption, loss of data or business information, loss of or damage to property, (iii) claims of third parties, or (iv) other pecuniary loss, arising out of or related to this disclaimer or the External Site

By entering the External Site, you further acknowledge and agree that the disclaimer of warranties and limitations of liability set out in this disclaimer shall apply regardless of the causes, circumstances or form of action giving rise to the loss, damage, claim or liability, even if such loss, damage, claim or liability is based upon breach of contract (including, without limitation, a claim of fundamental breach or breach of a fundamental term), tort (including, without limitation, negligence), strict liability or any other legal or equitable theory, and even if EVN and Virtua are advised of the possibility of the loss, damage, claim or liability. The waiver and release specifically includes, without limitation, any and all rights and claims pertaining to the processing of personal data, including but not limited to any rights under any applicable data protection statute(s).

If in any jurisdiction, any part of this disclaimer is held to be unenforceable by a court of competent jurisdiction, such part of this disclaimer shall be restricted or eliminated to the minimum extent and the remaining disclaimer shall otherwise remain in full force and effect.

Please note the information presented is deemed representative at the time of its original release. Changes in historical information may occur due to adjustments in accounting and reporting standards & procedures.

Non-IFRS Information

In addition to disclosing results determined in accordance with IFRS, EVN may also disclose certain non-IFRS and pro forma non-IFRS results of operations, including certain ratios, operational and miscellaneous data, as well as net income, diluted earnings per share, operating expenses, and operating income that make certain adjustments or exclude certain charges and gains that are outlined in the schedules included in this website. Management believes that this non-IFRS and pro forma non-IFRS information provides investors with additional information to assess EVN operating performance by making certain adjustments or excluding costs or gains and assists investors in comparing our operating performance to prior periods. Management uses this non-IFRS and pro forma non-IFRS information, along with IFRS information, in evaluating its historical operating performance. EVN and Virtua also take no responsibility for third party pricing data provided for informational purposes and certain ratio results formulated from the provided third party pricing data.

The non-IFRS information is not prepared in accordance with IFRS and may not be comparable to non-IFRS information used by other companies. The non-IFRS information should not be viewed as a substitute for, or superior to, other data prepared in accordance with IFRS.