Energy and Emissions and our Net Zero Commitment
Management Approach
Our approach to managing energy and emissions centres around managing our impacts on climate change through our Net Zero Commitment. In FY21, we committed to reducing our carbon emissions by 30% by 2030 and to be Net Zero by 2050 in line with the Paris Agreement and scenarios therein. This commitment recognises that climate change is one of the most pressing global issues
and that we must take serious action to ensure we have a future business, a clean and productive environment, and
a healthy and just society.
Our Net Zero Commitment is based on baseline data derived from an aggregate of all Evolution operations’
emissions in FY20. In FY23, the Mungari baseline was externally validated in alignment with the GHG Protocol and in FY23 there have been no adjustments to the Evolution aggregate FY20 baseline. Based on guidance from the GHG Protocol, we will update the baseline if there is a significant structural change in the business or methodology change. Internally we have set this threshold at a +/- 10% change to our Scope 1 and 2 baseline year emissions. This methodology has been further embedded into our internal procedures, planning and modelling processes in FY23.
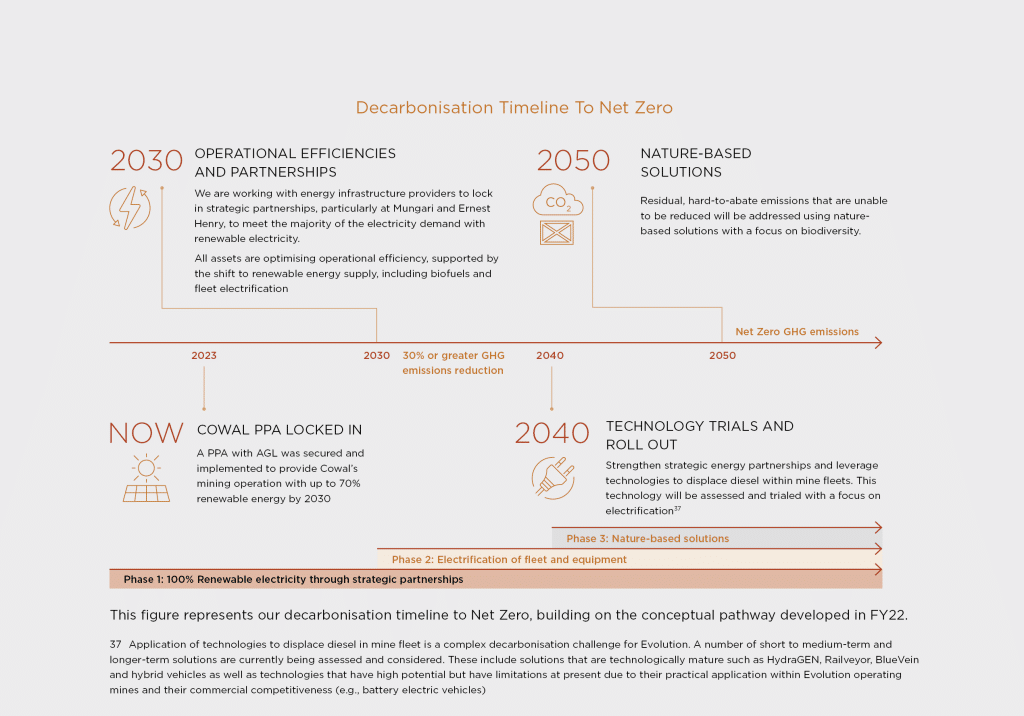
In line with our aim to reduce energy consumption while enhancing operational productivity, our key levers and actions on our pathway to Net Zero by 2050 include:
- Transition to 100% renewables and low-emission sources, with a medium-term target of >30% renewables by 2030
- Investment in low-emissions technologies focused on electrification of fleet and equipment
- Biodiversity investment and management
Operations are proactively engaged in achieving the medium-term and long-term emissions targets through understanding their carbon footprint, developing industry partnerships and investigating technology pathways. Our approach at the Group and Operational level to Net Zero is built upon key pillars of:
- Emissions and data forecasting with a split by value chain emissions
- TCFD Alignment and Climate Scenario Analysis, and consideration of emerging disclosures and frameworks such as the TNFD
- Emissions reduction pathways aligned with science based strategies
- Operational emissions optimisation through portfolio optimisation, decarbonisation projects and NPV
assessments - Enhancing understanding of current and future value chain emissions, and building relationships accordingly
- Project development and deployment through financing, capital allocation, and operational structures that embed emissions considerations
- Internal reporting to support employee engagement, and external reporting in alignment with ESG frameworks and Industry Association partnerships
- External assessment and review of disclosures and management to deliver best practice
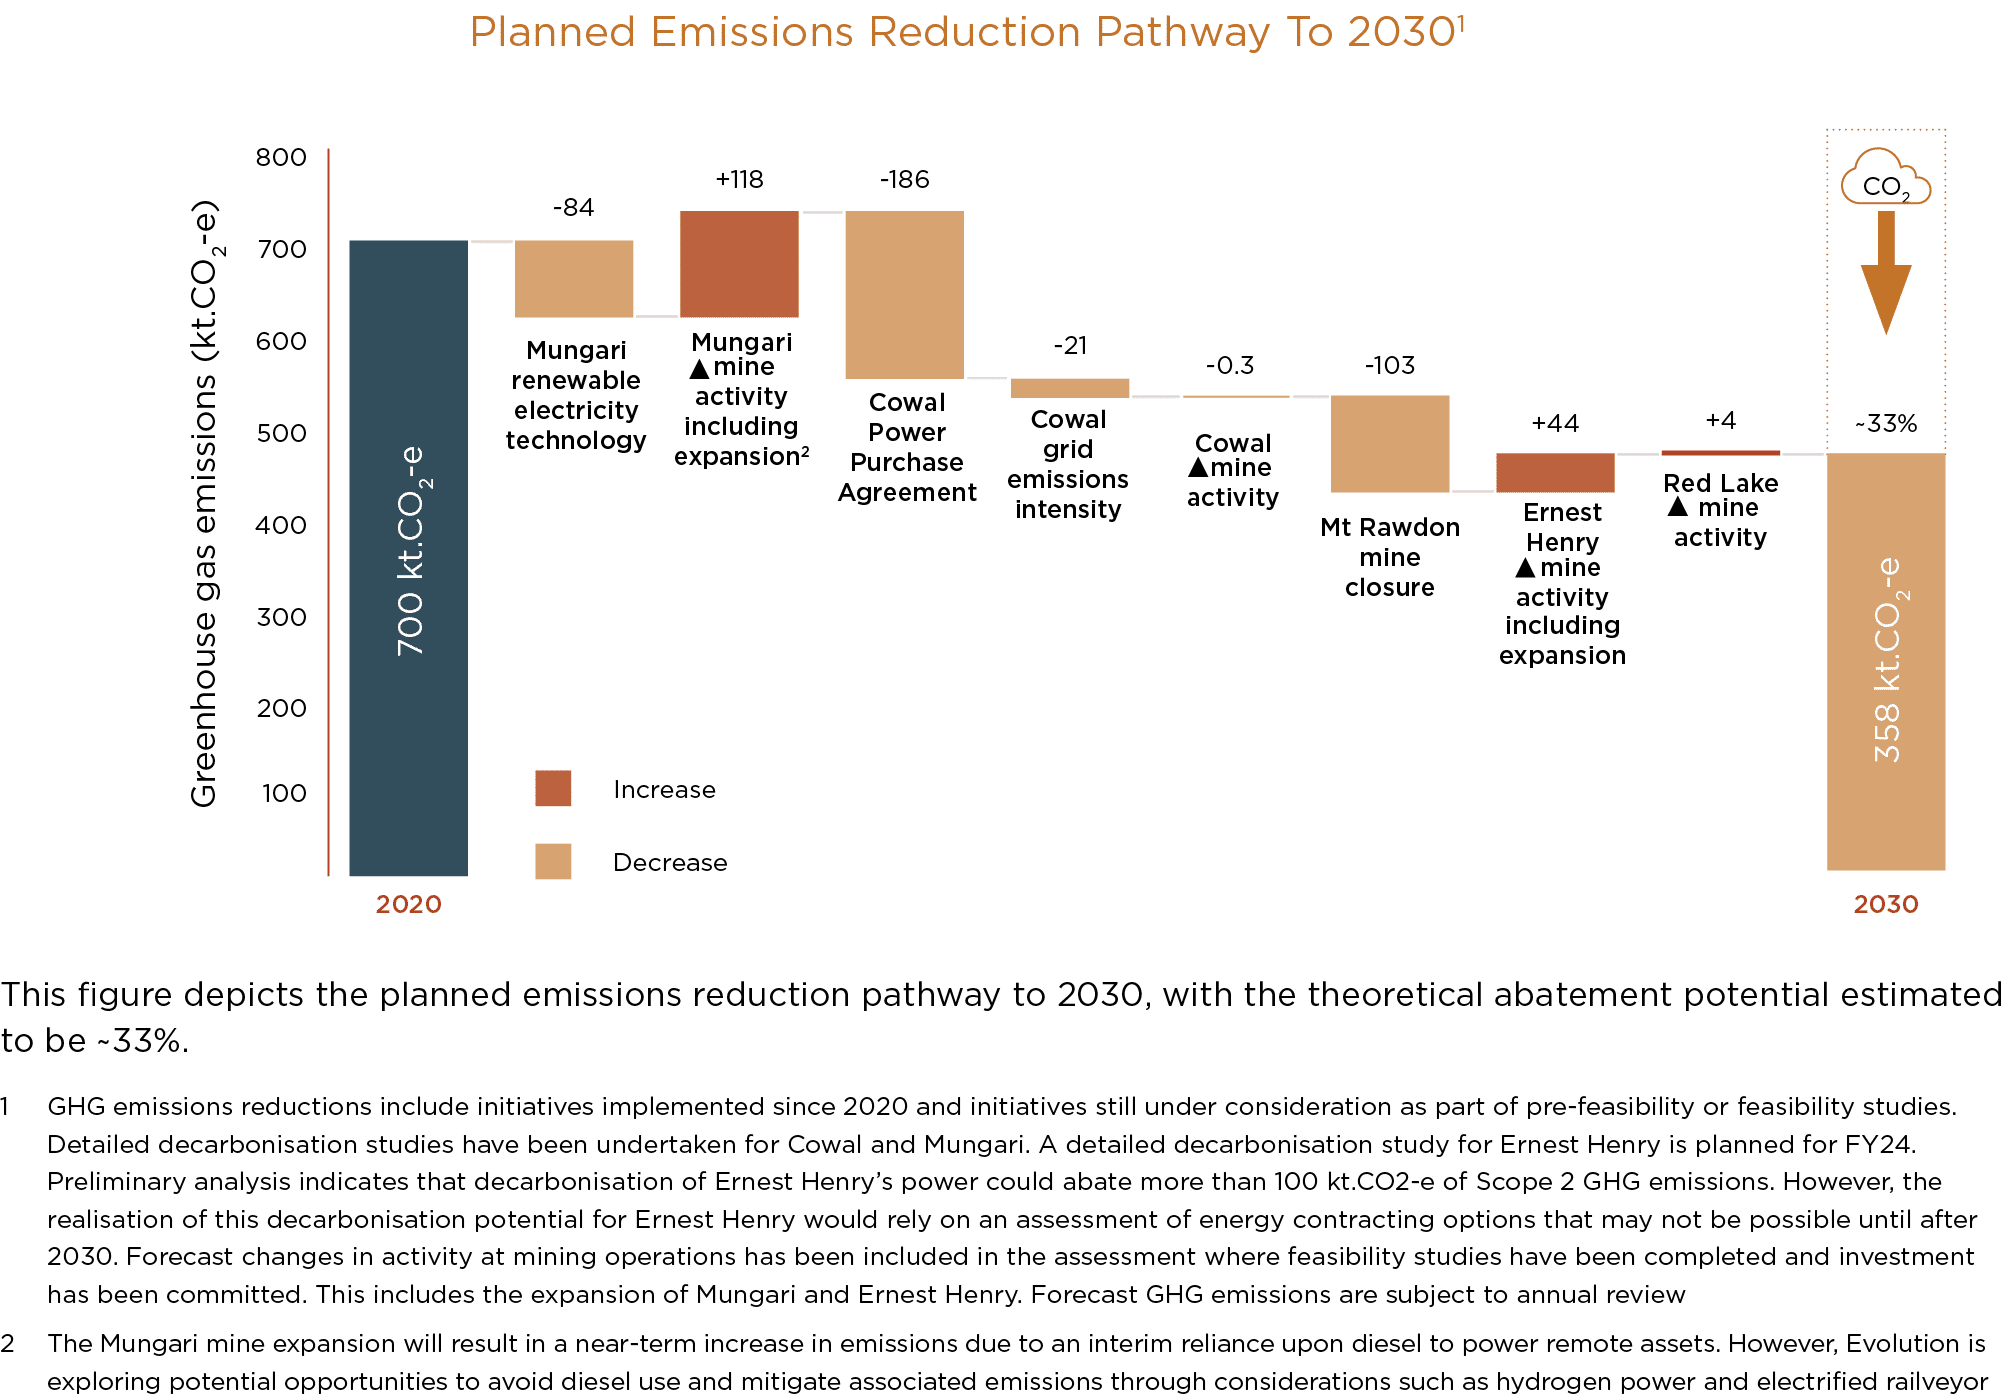
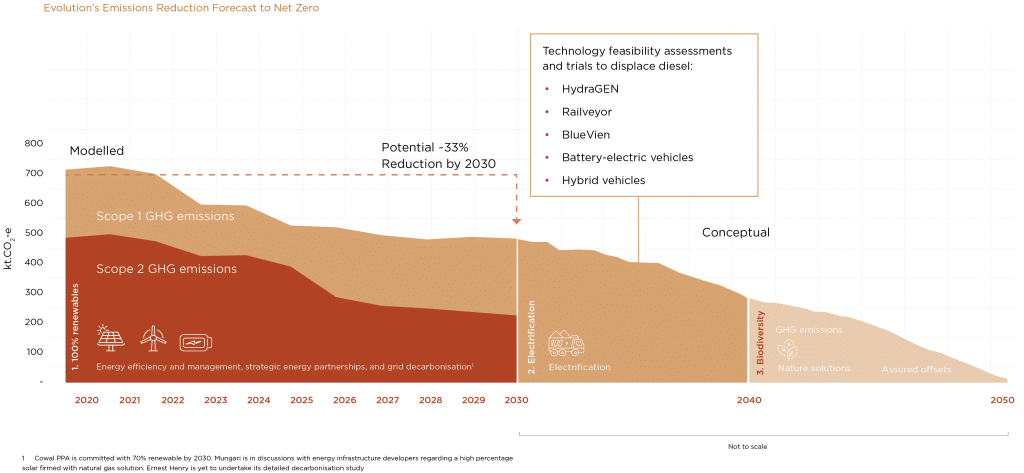
The previous figure visualises how our timeline and implementation interact and forecasts the impacts of our
emissions reduction pathway.
Evolution completed its annual NGER reporting which is independently audited and in FY24 will track its Net Zero targets via submissions to the Clean Energy Regulator using the CERT Framework. Detailed monthly capture and analysis of the energy and emissions performance
is conducted in alignment with Evolution’s Sustainability Performance Standards.
We recognise our contribution to GHG emissions, not only in terms of direct emissions, but also in terms of the value chain and indirect emissions. Our Scope 1, 2 and 3 emissions are externally validated, with Scope 1 and 2 included in this Report. Scope 3 emissions have
been collated internally in anticipation of increasing data collection, assurance, and achieving greater transparency in our GHG emissions reporting in future years.
Performance: Net Zero Milestones
We calculate key metrics and use targets to measure and monitor our performance and progress towards our Net Zero Commitment. In FY23, our internal awareness and capabilities in Net Zero were further strengthened through the FY23 Net Zero Future BBP Project. It built upon the progress made in FY22 by setting and achieving further milestones in our Net Zero journey, as described below. In the upcoming years, we look to further operationalise the milestones and outputs of the Net Zero Project to embed our commitment to Net Zero into capital investment, business planning and operational delivery processes. Our FY23 performance is summarised in the table below.
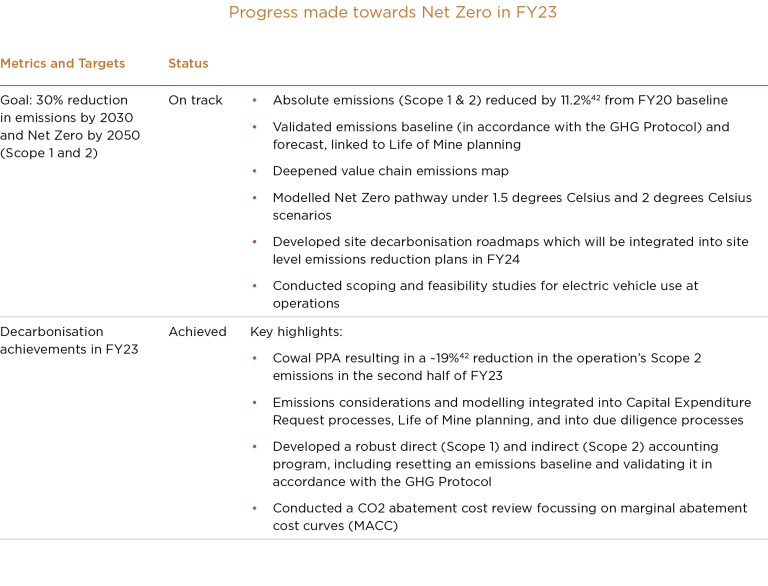
Progress made in FY23 toward achieving our Net Zero commitment in line with our key pillars is summarised in the following figure.
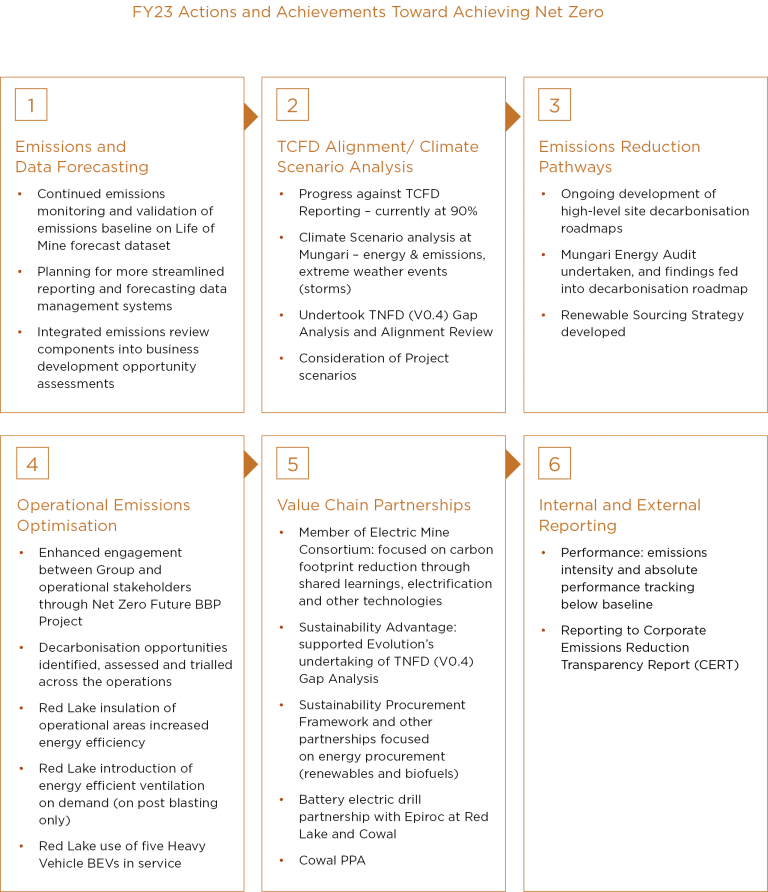
Renewable Sourcing Strategy
In FY23, Evolution developed, socialised, and measured against a Renewable Sourcing Strategy as part of the business wide Net Zero Future BBP Project. The Renewable Sourcing Strategy is managed at the Group level and intends to meet commitments to increase renewable energy usage applicable to all assets. It involves a core number of considerations including:
- Security of supply
- Price risk protection
- Flexibility to accommodate for changing power requirements for the business
- Emissions reduction
To further integrate Evolution’s Net Zero targets and commitments into the value chain, the emissions reduction pillar has been added to the sourcing strategy to ensure that renewable energy solutions are taken into consideration for all future power requirements. Key assessment criteria for the emissions reduction pillar include:
- Security of supply from renewable energy sources addressed through ensuring structuring, technology and counterparty risks are identified, assessed and mitigated/managed
- Renewables electricity pricing benchmarked against market pricing or a competitive procurement process
- Access to green credits where available and benchmarked against available market pricing
- Flexibility maintained in deal structuring to allow for changes in demand profile
- Whole of business view adopted whilst still maintaining a modular approach to renewable solutions
This strategy and commitments embedded therein were applied throughout the Cowal PPA process to deliver a robust, competitively priced long-term renewable energy solution in FY23. Read more about the eight-year partnership in the case study below.
Performance: Scenario Planning & Modelling in line with TCFD
Climate Scenario Analysis
While accurately predicting how future policies and climate impacts would unfold is challenging, scenario analysis can help highlight the range of physical and transitional risks that climate change may present in specific contexts and allow for improved resilience.
In FY22, we completed detailed scenario analysis of our highest producing asset, Cowal. In FY23, we completed a detailed scenario analysis of our second highest producing asset, Mungari. This has enabled the comparison of outcomes; supported the holistic identification and management of future risks, opportunities, and scenarios across the portfolio; and enhanced understanding of the business wide impacts to revenue, expenditure, operations, workers, supply chain and payments to governments.
We have deployed increased climate risk management rigour through overall operational analysis and the detailed scenario analysis exercises aligned with the recommendations of the TCFD, adopting Business-asusual, Mid-range, and below 2°Celcius scenarios including
Representative Concentration Pathways (RCP), NGFS, etc. The scenario analysis at Mungari tested additional scenarios that covered both physical and transitional risks.
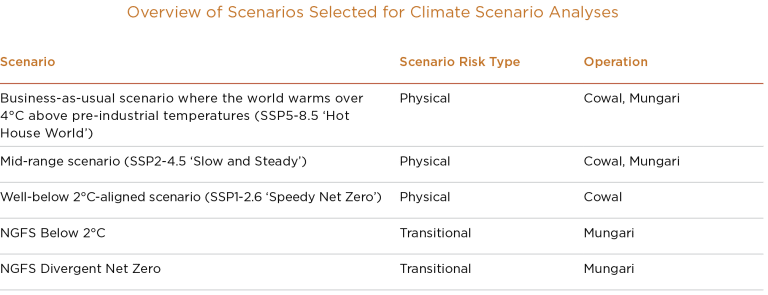
The main sources of information for the scenario analysis were the Intergovernmental Panel on Climate Change (IPCC) (for physical risks) and the NGFS (for carbon pricing).
The analysis identified risks such as wind damage, excess rainfall, flooding and lightning due to heavy rainfall events and windspeeds projected generally out to the year 2100. Additional risks included the electricity grid reliability, diesel consumption in equipment, and the potential impact of a carbon price on the asset and suppliers at Mungari. These risk factors had previously been identified and were further assessed.
In stress-testing against these scenarios, we’ve focused on indicators that can be used to support internal decision-making, while also informing local stakeholders of our position. Resilience measures will continue to be reviewed and refined as more analyses occur and
evolve over time, including options to incorporate more quantitative information.
Task Force on Climate-related Financial Disclosures
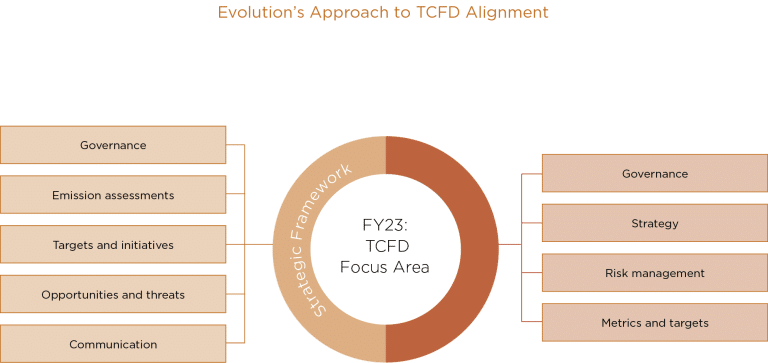
We recognise the recommendations of the TCFD, and that operations may be impacted by future changes in climate. In FY19, a strategic framework for climate change was developed which addressed governance, emissions assessments, targets and initiatives, opportunities
and threats and communication. Since then, we have integrated a strategic climate focus to align with the TCFD recommendations on Governance, Strategy, Risk Management, and Metrics and Targets. We maintain our commitment to increased transparency on climate
disclosure by formally supporting the TCFD.
n FY23, as in previous years, a review of our TCFD disclosures was independently conducted alongside a review of our disclosures with defined and emerging Sustainability disclosures. This included TNFD (V0.4) gap analysis and alignment review, which is discussed in the
Land Use and Biodiversity section of this Report. The analysis verified that Evolution’s alignment to the TCFD framework is still 90% compliant.
Disclosure alignment with the recommendations of the TCFD framework and internal capability with regards to the framework was enhanced in FY23. This included expanding stress testing climate scenarios from Cowal to Mungari and improving understanding and disclosures of climate-related financial impacts to the business. Actively tackling climate-related issues is essential to ensuring our relevance for the decades to come. It supports our reputation as a socially and environmentally responsible, and climate-conscious business.
Refer to the ESG Performance Data document for our TCFD index and detailed disclosures.
Performance: Scope 1 and 2 emissions
The FY23 Evolution emissions performance compared to FY20 is provided in the table below.
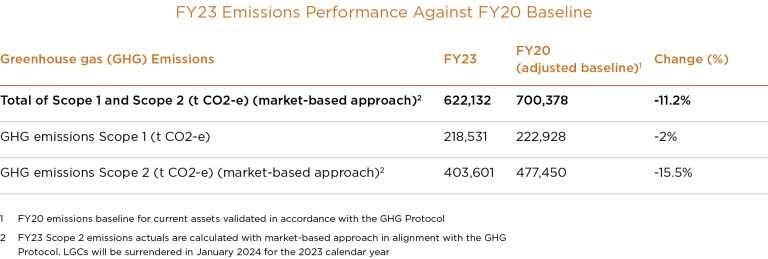
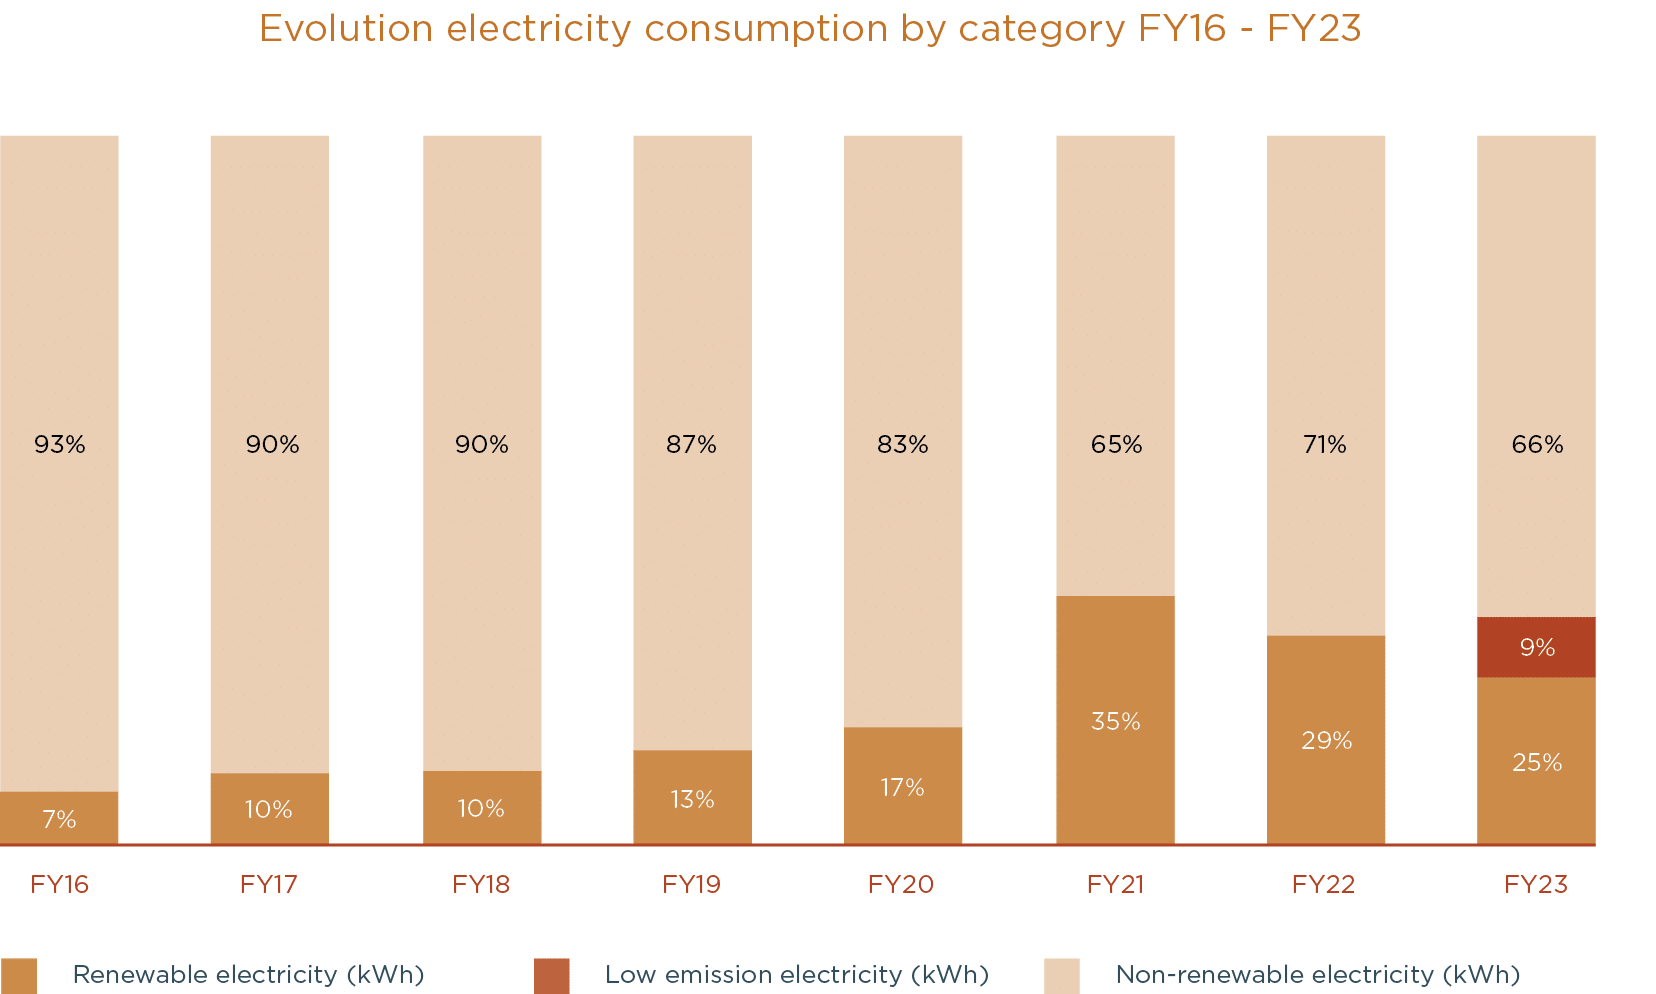
In FY23, the total emissions from fuels and electricity continued to trend downwards with an 11.2% reduction in emissions from FY20. In terms of renewables, 25% of all electricity consumption was renewable. GHG emissions broadly correlate with the energy-consumption trends
because Scope 1 reflects emissions from consumption of fuel while Scope 2 reflects emissions from consumption of electricity.
Compared to FY20 Scope 2 emissions (electricity) reduced by 15.5%. Cowal emissions decreased due to the renewable electricity purchased via the Cowal PPA.
Cowal, Mungari and Red Lake are currently leading the adoption of renewable energy for Evolution with 30% or more of their electricity from renewable sources. Partnerships supporting investment in renewable energy is Evolution’s preferred strategy to support our transition to
Net Zero, with opportunities presenting where we are grid connected in each jurisdiction in which Evolution operates.
The registration of the multi-year monitoring period with the Clean Energy Regulator has confirmed that Cowal is not considered a Safeguard facility as of FY23, i.e. they did not trigger the Australian Safeguard Mechanism threshold of 100,000 tCO2-e. Cowal was able to register for a multiyear monitoring period with the Clean Energy Regulator by demonstrating the operation’s Scope 1 emissions will reduce over the next two years following the peak construction works.
Scope 2 emissions reflect two thirds of emissions, with Cowal operations in NSW contributing almost half of all emissions.
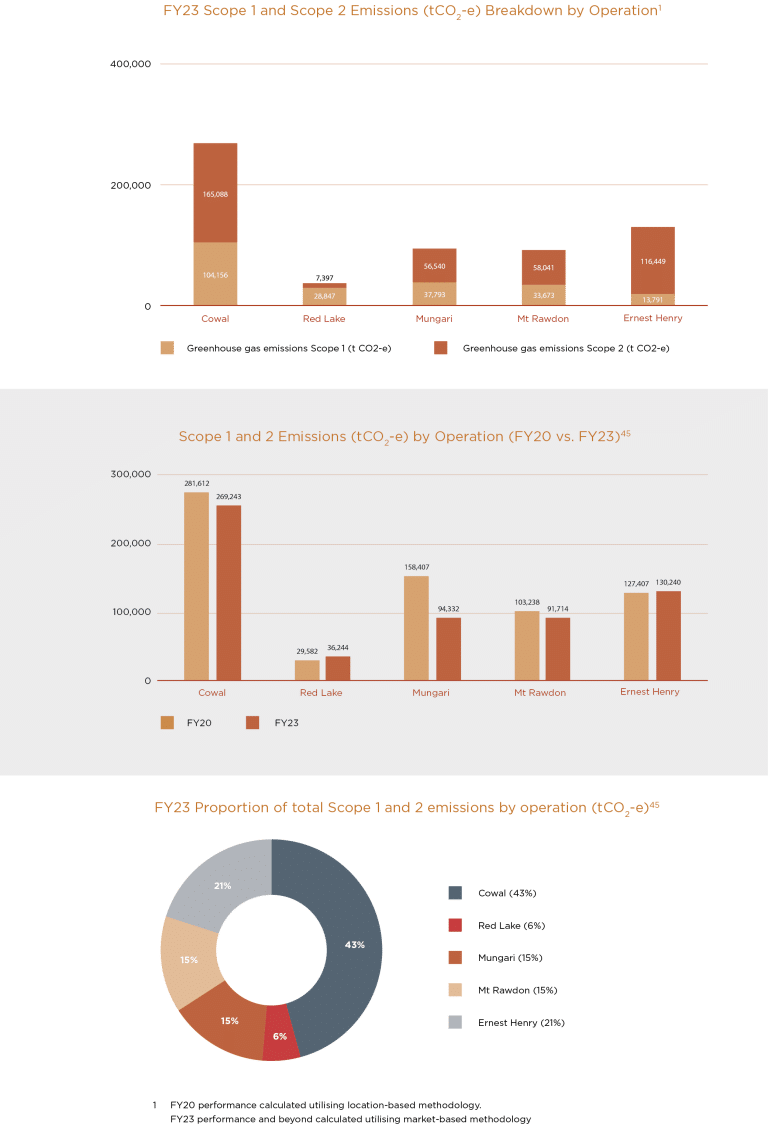
Intensity ratios allow the analysis of energy consumption and GHG emissions data in the context of an organisation specific metric. Our approach is aligned with the “per tonne mined” intensity metric, as it enables us to analyse data in the context of activity at all operations. The FY23 emissions intensity performance compared to FY20 is presented below.
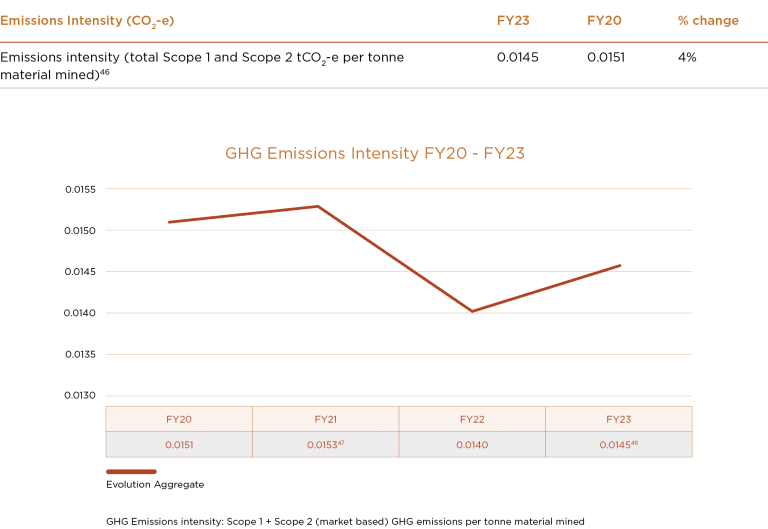
A 4% reduction in emissions intensity (per tonne of material mined) was achieved in FY23 compared to the FY20 baseline (0.0151). The performance of 0.0145 CO2-e/ t material mined was within the target range. The decrease in emissions intensity per tonne of material
mined is predominantly attributed to the Cowal PPA, efficiency improvements at Cowal (17%), and Red Lake (14%). These efficiency improvements can be attributed to a lower demand for diesel and electricity per tonne of material mined. We are exploring opportunities to
improve Ernest Henry’s emissions reduction as part of the mine expansion feasibility study commencing in FY24.
Scope 3 Emissions
Our internal Scope 3 emissions reporting continues to be underpinned by principles of transparency in methodology and selection of material categories, setting a good foundation and structure for reporting, and continuous improvement in disclosures.
In FY23, to further our progress around Scope 3 emissions associated with the value chain, we have:
- Internally calculated Scope 3 emissions across five reporting categories aligned with the GHG Protocol (Purchase Goods and Services, Capital Goods, Fuel and Energy Related Activities, Business Travel, Processing of Sold Products)
- Validated data through a third party
- Monitored our year-on-year historical Scope 3 trends
Evolution recognises and monitors the emerging disclosures and reporting requirements that promote the mandatory disclosure of Scope 3 emissions. Currently, Evolution discloses Scope 3 emissions to select ESG agencies. Scope 3 emissions will continue to be tracked internally and audited externally and will continue to be evaluated for disclosure future reports.
Case Study
Electric Vehicles: safe, efficient and electric
drills and partnership with Epiroc


